Explore: History • Learn • About
Climate Truth • TruthLights
|
Explore: History • Learn • About Climate Truth • TruthLights | Sponsored by: |
| . | |
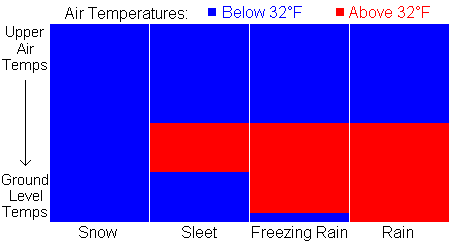
| How Different Precipitation Types Form | |
| |
| . | |
| Cold Air Damming Explanation | |
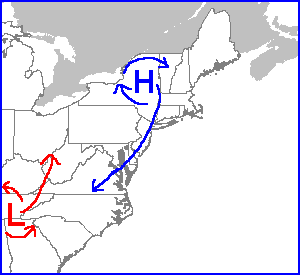 When a winter storm is approaching, I frequently mention the cold air wedge that forms east of the mountains in my forecast discussion. You may have wondered what that is, and that is why I decided to write this explanation. Cold air damming (or cadding for short), commonly referred to as the "wedge", often occurs in this area during winter storms, and occasionally during all-rain events as well. Cadding occurs when a cold-core (meaning it originated in Canada or the Arctic region and is cold at the center) high-pressure system is located to our north, typically in or near New England. Air flow around a high-pressure system is clockwise, which means that it will send cold air southward, into Virginia and the Carolinas, as the diagram to the right shows.
You can also see that the low-pressure system that is moving up from the south sends a surge of warm air northward to the west of the mountains. The typical result is a mixture of wintry weather to the east of the mountains where cadding holds temperatures below freezing, but temperatures are much warmer to the west of the mountains. The map below shows a classic cadding situation, with surface temperatures from 7 PM on January 26, 2004 (or 00 zulu/GMT time January 27).  Notice that cadding during this winter storm was particularly strong, with the freezing line (the top of the dark green area) going all the way down into northeastern Georgia. Sometimes cadding only stretches as far as northern South Carolina, it just depends on the strength of the high-pressure system in New England. Temperatures in this area were in the lower to mid 20s. However, just to the west of the mountains, it is much warmer, with temperatures in the lower to mid 50s in central Kentucky. The freezing line to the west of the mountains reached all the way into central Ohio and northwestern West Virginia. Cadding is part of what makes most winter storms so difficult to forecast in this area, because computer models have a difficult time dealing with it, and they tend to underestimate the cadding (in other words, their forecasts are usually too warm.) However, cadding has much less impact on temperatures in the upper atmosphere, where temperatures often rise above freezing during winter storms. Since upper air temperatures usually determine precipitation type, that is why we usually get a wintry mix instead of just snow. Even though cadding keeps surface temperatures well below freezing, the temperatures in the upper atmosphere warm up into the mid or upper 30s, and that situation would cause sleet and/or freezing rain to fall. During the time frame depicted in the map above, although temperatures were in the mid 20s, we were getting freezing rain, because upper atmosphere temperatures were much warmer. | |
| . | |
| Weather Term of the Day | |
| For about a 3-month period in the fall of 2007, I included a weather term along with its definition on my website each day. If you missed some of these or would just like to review them again, you can click here (right-click, save target as) to see the list of terms and definitions that I used. Or, click here for the complete glossary from the NWS. | |
| . | |
| Computer Models Explanation | |
| The term "computer model" is used often in the Forecast Discussion. A computer model is a sophisticated computer that receives all the current data and outputs a forecast. The forecasts go out to 2 to 16 days and are updated 1 to 4 times daily depending on the model. | |
| . | |
| The Truth About Global Warming / Climate Change | |
|
(I wrote this article in the summer of 2007. For more recent information, click here to visit my Climate Truth website.) "Global Warming." Such a simple phrase, yet one that is surrounded by an incredible amount of controversy. My purpose in writing this is to inform the general public about the issue, and to help separate facts from fiction. There is a significant amount of misinformation out there, primarily due to the fact that some people are trying to use the issue to gain some kind of a political advantage. While I do have a strong opinion on the issue, I will make a point to clearly distinguish between the facts and my opinions. You can either read the entire article, or jump to a section of interest: • We've only been collecting reliable data for about a half-century at most • Quality control issues with the data that we do have • Recent corrections to NASA global temperature data point to the warmest decade on record being the 1930s • Changes in the level of carbon dioxide in the atmosphere likely cause changes in temperature, not the other way around • We know that hurricane activity goes in cycles of about 30 years • Dr. William Gray's comments on global warming • The unnecessary involvement of politics in the debate • Lynchburg's data dates back to the 1890s, and they rarely set record highs; over 130 of their record highs were set in the 1930s • 24 all-time state record highs across the country were set in or around the 1930s, while just two have been set in the last 10 years • Conclusion Fact: Unfortunately, and contrary to what you may have heard, the only fact about the entire global warming issue is that we have no idea what the cause is, or even if we're warming much at all. People have strong opinions on both sides of the issue, but despite what anyone may try to tell you, that is the only fact. We simply don't know. I'll start with the latter point. "Of course the earth is warming; even if we're not causing it, all the data says we're warmer than we've ever been!" You've probably heard that argument, but is it correct? Actually, it's far from it. First of all, we only have reasonably accurate temperature data across the world going back a few decades--50 years at most. When we're dealing with something this complex, 50 years of data is practically nothing, and certainly isn't anywhere near enough to even begin making a conclusion one way or the other. Secondly, even with the data that we have, there are significant quality control issues. Some observation sites are moved around a lot over time, especially in certain parts of the world such as in China. Any time a site is moved, its data is basically rendered useless, because every location has its own localized climate. Aside from that problem, some stations that have remained in the same location in a big city for a long time are now becoming subject to the "urban heat island" effect. Apart from the issue of global warming, there has been definite warming in urban areas over the last few decades. Researchers have attempted to introduce corrections to that data to account for the heat island effect, but there is really no way of knowing if those corrections are accurate or not. In addition, I recently became aware of the alarming fact that there are significantly fewer observation sites around the world than there have been in the recent past, and many of those that have disappeared have been in cooler areas. Russia, in particular, has lost many, many stations since the breakup of the USSR, and obviously that is one of the colder parts of the world. Losing that much data from a large, cold part of the world is sure to cause a bit of an increase in global temperature averages, even if there has been no change at all. Finally, a significant discovery was revealed in early August of 2007. Unfortunately, it was largely ignored by the media of this country, although it was published in an Australian newspaper. So, what is this discovery? Apparently, NASA had some kind of a Y2K computer bug that caused a glitch in their global temperature data. Essentially, the glitch caused data from the last decade or two to appear warmer than it actually was. The scientists who researched this issue claimed to have a lot of difficulty in even getting access to some of this data, but once they were finally able to, they found the problem and corrected it. (If you would like to read more about this: 1998 no longer the hottest year on record in USA or Cold, hard facts take the heat out of some hot claims) With this discovery, 1934 has now moved into the top slot as the warmest year on record, and the infamous warm year of 1998 drops back to second place. In fact, 4 of the top 10 years are now in the 1930s, making it the warmest decade on record. Along with one in the 1920s and another in the 1950s, that gives us a total of 6 years prior to 1960 among the top-10 warmest on record. Just 3 of the top 10 years occurred in the 1990s, and 2006 is the other. My reason for explaining all of that is to show you an example of how many problems we have with global temperature data, and how it's not particularly useful in trying to prove anything because it simply can't be trusted. If a simple computer glitch causes us to think that a certain year was the warmest on record and that turns out not to be the case, how can we rely on any of this data? It is for these reasons, among many others, that we truly have no possible way of knowing whether or not global warming is even occurring, and we won't for a long time to come. Opinion: The facts show that we can't prove whether the planet is warming, cooling, or staying about the same. But, my opinion on the issue goes far beyond that. While we are clearly in somewhat of a warm period, that's all it is--a period. Humans are having little to no impact on the environment, and it's all a natural cycle. In fact, I believe it is likely that we will enter a cooler period within the next 10 to 15 years. Unfortunately, given the data problems I discussed earlier, we don't really have any way of knowing if humans are impacting the environment or not. But I strongly feel like we are not. First of all, the atmosphere is large and incredibly complex. Based on that simple fact, I already have doubts that anything we could do on the ground could have anything more than a minor impact on the atmosphere. Going one step further, I have seen data on multiple occasions that indicates the opposite of what most people believe. (Note that this is in the "opinion" section because I have no way of verifying whether or not it is accurate, although it does have a reasonable amount of evidence to support it.) This data states that, contrary to popular belief, changes in the level of carbon dioxide in the atmosphere are a result of temperature changes, not the cause of temperature changes. Basically, the data shows that temperatures increase, THEN carbon dioxide (CO2) levels increase. If CO2 levels only increase after temperatures already have, how can an increase in CO2 cause an increase in temperature? It can't. If this data were to be proven true, it would basically put an end to all the talk of human-induced global warming. Unfortunately, like so many other things I have discussed, it's unlikely that it can be proven beyond any doubt, and so the debate continues. We know for a fact that hurricane activity in the Atlantic Ocean has a cycle of about 30 years. We saw increased activity in the 1930s, 40s, and 50s, then decreased activity in the 60s, 70s, and 80s. Yes, Hurricane Camille did hit in 1969, but overall, those three decades were quieter. Another more active period began in the early 1990s, and it is expected to continue until about 2015 or 2020. The fact that we saw 27 named storms in 2005, near the middle of a cycle of increased activity, was not really a shock. No one expected to see quite that many storms, but still, it wasn't a huge surprise to most people. (Despite the fact that 2005 will officially go on record as being the most active season since records began in 1888, that is likely not the case. 1933 held the old record, and we had 21 named storms in that year. But, keep in mind that satellites had not yet been invented in 1933, and it is extremely likely that several storms developed out in the middle of the Atlantic that no one ever knew about. If we had today's technology back then, 1933 likely would have featured more than 27 named storms.) Given that fact, isn't it reasonable to assume that the overall climate may have a similar cycle? After all, we know the 1920s and 1930s were as warm if not warmer than today, and don't forget that the 1930s was referred to as the "dust bowl". It was hot and dry, and there was a lot of hurricane activity. Sounds a lot like today, doesn't it? Temperatures cooled back down after that, and the period from the 1960s to the 1980s was fairly cool across the country and probably across the world as well. We started to warm back up after that, but who's to say that we won't start cooling back down in the next 10 to 15 years? A number of top meteorologists agree with that prediction. Dr. William Gray has made some strong comments against global warming in recent months. He is a well-known hurricane forecaster at the Colorado State University, and is quite possibly the most knowledgeable person in that field. He made seasonal hurricane predictions for about 30 years before turning that job over to his mentee. He strongly believes that global warming is NOT a reality, and has had some strong words for the people he calls "global warming alarmists". Dr. Gray has been quoted as saying "I have a bit of an obligation, at my age -- I was trained to tell the truth. There's a lot of hogwash in this." (Interview with Dr. William Gray) Why anyone would listen to Al Gore and not listen to the top hurricane expert in the country about the issue of climate change is something I'll never understand, but that certainly seems to be happening to some extent. Speaking of Gore, politicians are a big reason why this debate has really gotten out of hand. I won't name names (aside from him) and I won't name parties, but there are some very alarming things going on. Dr. Gray has clearly stated that he had a lot of difficulty even getting grants to help him with his research, because of his view on the issue. There are also some people who will quickly state that "global warming is real and humans are causing it; all scientists agree and the debate is over." It is VERY concerning to me whenever one side of a debate tries to censor the other side (such as Heidi Cullum of The Weather Channel, who believes that any television meteorologist who doesn't believe in global warming should be stripped of their American Meteorological Society seal), or even pretend that it doesn't exist at all. That instantly tells me that the side attempting to do the censoring doesn't think their side of the debate is foolproof, but they want to convince people that it is. But that's not how to have a healthy debate. Because of what other people have chosen to do, I felt like I needed to briefly touch on the political side of the debate, although it really shouldn't be a political issue at all. Finally, I want to touch on the significance of some record temperatures. During the summer of 2007, especially, we saw frequent record highs and record high minimums (the warmest morning low on record) across the region. Our National Weather Service office (Blacksburg) maintains official climate data for five locations. Four of those (Danville, Roanoke, Blacksburg, and Bluefield WV) averaged around 15 records during the month of August alone, for a combined total of 60 records. However, the other station in Lynchburg only set 2 records during the month. The National Weather Service attributed some of that to the fact that Lynchburg was farther away from the center of the hot air mass. While it's true that could have some impact, I don't think it was enough to make much of a difference. So, why did Lynchburg only set 2 records while the other locations set around 15? It's simple. The other four stations have data going back about a half-century, while Lynchburg's data goes back 115 years, all the way back into the 1890s. The much longer period of record, combined with my hypothesis that it was actually quite a bit warmer in the 1930s than it is today, are the main reasons why Lynchburg rarely sets new temperature records. Over 130 (more than one-third) of Lynchburg's daily record highs were set between 1930 and 1941, while only a handful have been set in the last five years. (I was unable to find an exact count, but it's probably between 5 and 10.) This data overwhemingly supports the idea that it was much warmer in the 1930s. We do have to keep in mind that we're only talking about one location, but I feel like it is fairly representative of the overall pattern. Since I originally wrote this, the month of September brought forth a continuation of heat. Danville had 14 days with highs at or above 90, close to the record for September of 17 such days. Lynchburg had half as many 90+ days with 7, but that was far short of their record of 15, which was set back in September 1933. If Danville's records extended back that far, their record would have likely been quite a bit higher than 17 days. As hot as this September was overall, I have a feeling it was much, much hotter back in 1933 (which was also likely the most active hurricane season on record, as I discussed a little earlier). The other aspect related to record temperatures concerns state records. Each state has its all-time record high temperature on record. Virginia's record high is 110, set in 1954 at Balcony Falls. Now, when you look at the list of record highs as a whole, things get really interesting. 24 (roughly half) of the 50 state record highs were set between 1930 and 1937. In fact, three record highs have held since 1900 or before. Contrary to that, just 8 state record highs have been set in the last 30 years, and just 2 have been tied since the turn of the century (South Dakota tied its record in 2006, and Arizona did the same in 2007). Since both of those temperatures just tied the old records, there really hasn't been a new statewide record high temperature set since 1995. If global warming was such a serious problem, don't you think we would have set more state record highs by now? We haven't set any state record lows since the turn of the century, although we did set 6 new records in the mid to late 1990s. Four of those were set in early February 1996, which also marks the time frame of the lowest temperature I have ever recorded (-2, but my records only date back to 1995). Based on that data, as well as a number of other factors and simple observation, it seems obvious that we're not in cold pattern. But at the same time, it's not as warm as some would have you believe, either. My main point is this: it is extremely likely that humans are having little to no impact on the environment, and most likely we are simply in a warmer cycle, as has happened time and time again over the course of history. Don't forget that the same group of people that is screaming "global warming!" today was screaming "global cooling!" back in the 1970s. When they start screaming about global cooling again in about 30 or 40 years, just think back to our current debate. Remember the truth, that we have no way of knowing anything in this debate for certain, but also remember the likelihood that it's all just a natural cycle. | |
| . | |